
Regression modeling in the energy sector.
The energy sector deals with many volatilities and uncertainties, and one of these is the price of electricity.
Utilities consider many factors when they are determining price, but mainly the market is impacted by supply and demand. With the cost of generation affecting more than 50% of electricity price, it is logical to examine the relationship between the consumption of fossil fuels for electricity generation and residential electricity prices.
For this, we use linear regression analysis.
Regression models help us examine and understand the strength of relationships between variables — estimating the effect of one variable on another, predicting target variables and modeling an interaction effect between variables.
We can use linear regression analysis to explore the relationship between variables in the energy space and understand the impact that consuming fossil fuel for electricity generation has on electricity price.
In this case, we can use linear regression analysis to explore the relationship between variables in the energy space to understand the impact that consuming fossil fuel for electricity generation has on electricity price.
Electricity price depends on numerous factors not limited to location, time of year, consumption and market changes or fluctuations. The residential price of electricity is reported in cents per kilowatt hour (kWh), and the data is sourced from Energy Information Administration (EIA) annual reports.
Data on consumption of fossil fuels (coal, petroleum, natural gas and other gas) for electricity generation also comes from the EIA.
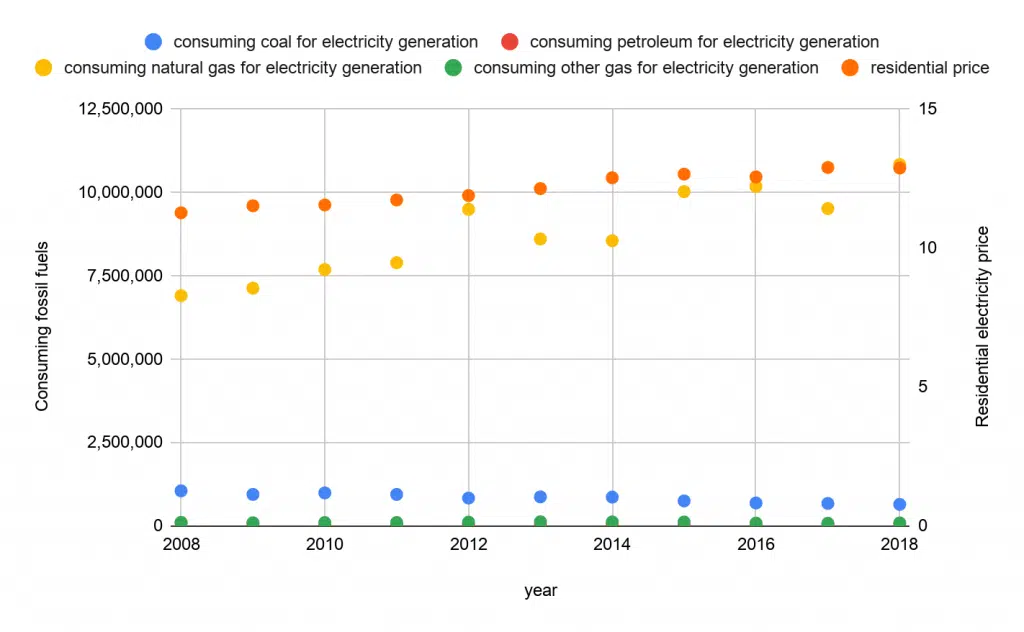
From the chart above, we can infer that some type of relationship exists between electricity price and consumption of fossil fuels, but it is not clear. Using the regression model, we can better understand it.
We can determine what the exact price of electricity will be, based on X amount of coal, petroleum and natural gas consumed in generation.
Before diving into the results, it’s important to understand that linear regression models require the following rules.
- Linear relationship — If the relationship between electricity price and consumption of fossil fuels is far from linear, then the conclusions drawn from the model are suspicious.
- Multivariate normality — This assumption states that the electricity price and consumption of fossil fuels for electricity generation data follow a normal distribution curve with no outliers.
- No or little multicollinearity — This assumption states that there is little or no collinearity between two or more independent/predictor variables (in this case, it is the consumption of fossil fuels for electricity generation). Otherwise, it would be difficult to determine the individual impact of consuming coal for electricity generation, consuming petroleum for electricity generation or consuming natural gas for electricity generation on the response/dependent variable (residential electricity price).
- No auto-correlation — This assumption states that the error terms should be uncorrelated given that correlated error terms can make a model appear to be stronger than it is.
- Homoscedasticity — The model assumes the error terms have a constant variance.
Linear regression is expressed as Y = a + bX.
Y is the dependent variable, and X is the independent variable.
a and b are the coefficients (we use the coefficients to make predictions with the model).
To find the coefficients, we need to minimize the least squares or the sum of squared errors. The least squares refer to the fact that it finds the average change in electricity price caused by a change in consumption of fossil fuels for electricity generation through the line of best fit. The least square or sum of squared errors is the difference between the actual values and the predicted values (line of best fit).

The equation for our model can be written as:
Residential electricity price = 18.54 – 7.08 (consumption of coal for electricity generation) + 5.62 (consumption of petroleum for electricity generation) – 2.29 (natural gas consumption for electricity generation) + 1.29 (consumption of other gas for electricity generation).
From the regression model, we learn that residential electricity price has a negative relationship with consumption of coal and natural gas for electricity generation. The higher the price, the less coal and natural gas will be consumed.
We also learn that residential electricity price has a direct positive relationship with consumption of petroleum and other gas for electricity generation. The higher the residential electricity price, the higher the consumption of petroleum and other gas.
To stay ahead of the curve in the energy sector and pull insights for marketing metrics relationships, it is paramount to make decisions using linear regression analysis.
Resources
Data sourced from https://www.eia.gov/electricity/annual/
https://www.eia.gov/electricity/annual/html/epa_01_02.html